Alpine Pipe’s steel pipe EPD: connecting Malaysian manufacturing with the Chinese steel supply chain
A steel pipe manufactured in Malaysia also carries impacts from the upstream production of its materials. Alpine Pipe’s registered EPD for ERW and SSAW pipes combines manufacturer information with HiQLCD 1.4.0 and ecoinvent 3.12 backgrounds to describe raw-material supply, manufacturing and end-of-life scenarios.
Case at a glance: the scope behind one tonne of pipe
2,350 is the EPD’s reported product-stage result, not a result attributable to one database or an emissions reduction from adopting data. Source: EPD pp. 8, 10 and 12.
Where is the pipe made, and where do its materials come from?
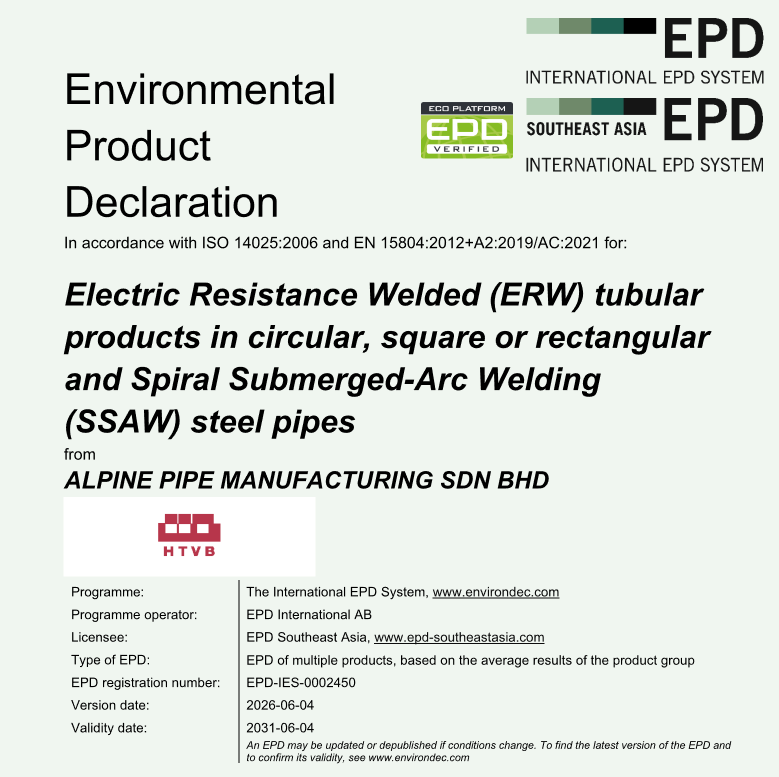
The declaration by ALPINE PIPE MANUFACTURING SDN BHD covers electric-resistance-welded (ERW) circular, square and rectangular hollow sections, together with spiral submerged-arc-welded (SSAW) steel pipes. The EPD reports average results for the covered products, providing a common declared basis for understanding their environmental performance.
Steel coils are the main feedstock. According to the report, suppliers are mainly located in China, and coils reach the factory by sea and road before slitting, welding and forming. Factory material and energy quantities alone do not describe the impacts incurred before the coils arrive. Upstream steel-production and transport backgrounds supply that part of the product system.
Production, end of life and recovery potential have distinct boundaries
The assessment uses one tonne of pipes as its declared unit. It covers material supply, inbound transport and manufacturing (A1–A3), deconstruction through disposal (C1–C4), and benefits and loads beyond the system boundary (D). Product distribution A4, installation A5 and use-stage modules B1–B7 are not declared. The value of 2,350 kg CO₂ eq therefore does not represent a complete lifecycle result for every use scenario.
| Model element | Treatment in the declaration |
|---|---|
| Product stage | A1–A3; manufacturer data for August 2024–July 2025 |
| End of life | C1–C4; 85% recycling, 15% landfill scenario |
| Beyond the system boundary | Module D reported separately |
What do manufacturer inventories and HiQLCD each contribute?
Manufacturer information describes the materials, energy and activities involved in making the pipes. Background databases connect those inputs to upstream production. The report lists both HiQLCD 1.4.0 and ecoinvent 3.12 for steel production, while manufacturing electricity, material transport and other processes are listed under ecoinvent 3.12.
HiQLCD is one source of upstream steel background data in this assessment. The public EPD establishes its use but does not disclose a record-by-record dataset list or its independent contribution. It therefore does not support attributing every upstream impact, every Chinese input or the entire EPD result to HiQLCD.
| Data layer | Disclosed source and role |
|---|---|
| Foreground | Manufacturer information describing pipe production |
| Steel-production background | HiQLCD 1.4.0 + ecoinvent 3.12 |
| Electricity, transport and other backgrounds | ecoinvent 3.12 |
| Assessment | Inventories, backgrounds and declared scenarios combined in jimuLCA 3.0 |
What the results show: start with material supply and manufacturing
The EPD reports an A1–A3 GWP-total of 2,350 kg CO₂ eq per tonne of pipes, exceeding the positive result of any individual C1–C4 module. Further investigation should therefore begin with material supply, transport and manufacturing together, then examine steel sourcing, production routes and factory energy. The public module table does not separate A1, A2 and A3, so this value alone cannot quantify the individual share of steel or factory electricity.
The recovery scenario also affects end-of-life results and module D. The 85% figure is a declared recycling assumption, not a guarantee of the future destination of every pipe. Potential benefits in D are not emissions reductions already achieved during manufacturing. For another pipe product, revisit specifications, suppliers, steelmaking routes, factory energy, transport and end-of-life conditions.
From a published EPD to your own steel assessment
This case illustrates how information from an overseas factory can connect with Chinese supply-chain backgrounds. The modeling approach is transferable; the numerical results remain specific to the EPD’s products, data period and scenarios. HiQLCD supplies background data, while EPD preparation, independent verification and programme registration follow the responsibilities identified in the original declaration.
For a pipe or another steel-product assessment, start with material specifications, supply locations, production routes and your existing inventory. Check relevant background records for technology, units and boundaries, then confirm versions, software formats and EPD programme requirements.