
Modeling a PV system from Chinese production to use in Germany
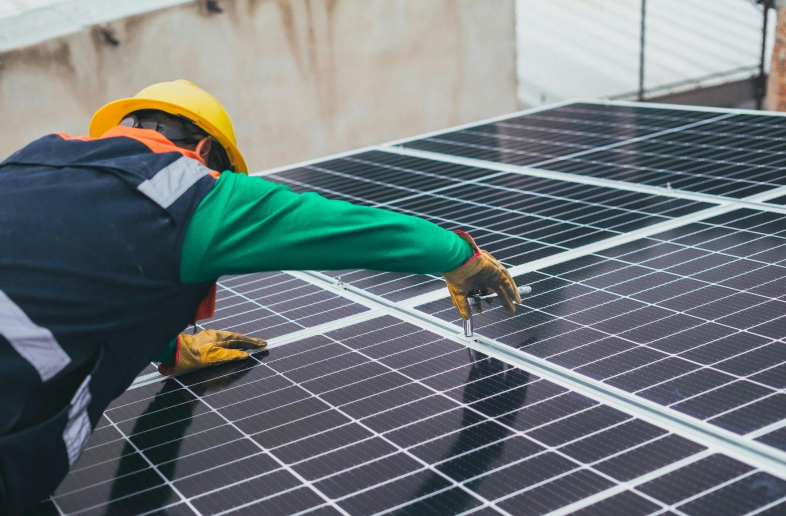
An internal modeling study by GreenDelta combines HiQLCD and ecoinvent for a rooftop PV system produced in China and used in Germany. The case shows how regional data connect and why technology matching and inventory conversions matter when interpreting results.
One system, two regions, one electricity reference
This page summarizes the modeling study in the 2025 report. Quantity conversions and end-of-life inventories contain unresolved issues; numerical results below are quoted from that report, not recalculated or presented as a verified product footprint.
Connecting production, transport, generation and end of life
The study includes PV modules, mounting structures, an inverter and junction boxes, using a 3 kWp rooftop system as its reference. The boundary extends from materials and manufacturing through transport, installation, 25 years of generation, dismantling and end-of-life treatment. Generation assumptions relate to German conditions. Results are expressed per 1 kWh generated over the lifetime, not per 1 kWp of installed capacity.
Production is situated in China. The report selects Shanxi records where available and national records otherwise; this does not mean that every component is represented by measured Shanxi data. Transport runs through Shanghai and Rotterdam to Berlin, with subsequent activities represented using relevant European or German backgrounds.
Combine backgrounds by lifecycle stage
HiQLCD represents production of the PV modules and associated components, road freight in China and sea transport to Rotterdam. Ecoinvent 3.11 represents freight from Rotterdam to Berlin, installation, use and end of life. System size and component quantities start from an ecoinvent rooftop-installation inventory and are adapted to the reference units of the selected HiQLCD records.
Inverter scaling, mounting conversion and the electrical-installation substitution are modeling choices; matching names and units does not establish equivalent technology or scope.
| Model input | Treatment in the combined model |
|---|---|
| PV modules | Chinese module record linked at 3000 Wp |
| Mounting structure | Area-to-kg conversion and a Shanxi record |
| Inverter | Larger string-inverter record scaled linearly to a cumulative 6 kWp demand |
| Electrical installation | 5.66 junction boxes substitute for the original aggregated electrical-installation item |
Modules and mounting dominate the reported climate result
The combined model reports a climate result of 0.0344 kg CO₂-eq/kWh, equivalent to 34.4 g CO₂-eq/kWh. Figure 5 attributes 70.40% to single-silicon modules and 22.80% to mounting structures. Within this model, checking module and mounting technology and quantities is more informative about the main contributions than focusing only on installation electricity.
Source: report p. 23, Figure 5. Selected background contributions do not sum to 100%. The HiQLCD system-process inventories used are aggregated, so internal material contributions cannot be inferred from this result.
| Reported climate contributor | Share of combined-model total |
|---|---|
| Single-silicon modules | 70.40% |
| Mounting system | 22.80% |
| Inverter | 2.93% |
| Junction box | 1.74% |
Two configurations reveal differences and matching requirements
The report also builds an ecoinvent-only model, using the listed global-market records for component supply. Its climate result is 0.112 kg CO₂-eq/kWh. However, mineral and metal resource use and water use are higher in the combined model, so climate alone does not establish overall environmental superiority.
Source: report Tables 12 and 14. Geography, technology scale, efficiency, unit conversions and electrical-installation scope also change. This is not a controlled comparison changing only database brand, nor evidence that Chinese data are generally unavailable in ecoinvent.
| Indicator | HiQLCD + ecoinvent | ecoinvent-only | Unit per kWh |
|---|---|---|---|
| Climate change | 0.0344 | 0.112 | kg CO₂-eq |
| Mineral and metal resources | 2.31 × 10⁻⁵ | 2.37 × 10⁻⁶ | kg Sb-eq |
| Water use | 0.230 | 0.128 | m³ world-eq deprived |
Check quantity conversions and scope before reuse
The report proxies a residential inverter with a larger string-inverter record and substitutes junction boxes for an electrical-installation item that also includes cabling and connectors. Explicit transport masses cover modules and mounting structures, while end-of-life treatment is simplified to major materials and electricity. These choices limit direct comparability between the configurations.
The report’s mounting area-to-mass expression does not match its stated result, and the relationship between module transport/end-of-life mass and the 3 kWp system requires checking. Junction-box end-of-life copper is not calculated using the copper fraction stated in the text. These results can illustrate the modeling approach and reported findings; product comparisons or external reduction claims require inventory correction, review and recalculation first.
Find matched data for your PV system
Specify module technology, rated power, area and mass, mounting type, inverter capacity and replacement assumptions. Add production and use locations, lifetime generation and end-of-life assumptions. These details allow background records to be selected and show which processes can be connected directly and which require conversion or additional data.
Source: Chiara De Grandis, GreenDelta, Case study: modeling the life cycle of a PV system with HiQLCD and ecoinvent databases, version 1.0, 1 September 2025. This page summarizes the source with its limitations; the model has not been recalculated.